

Why You Need to Deep Dive into Website Tracking to Improve Customer Engagement
Pageviews, unique pageviews, new visitors, and returning visitors are all separate metrics despite seeming similar. If you aren’t cautious with your interpretation of your website analytics, you might end up drawing false conclusions. That’s why every company needs to understand how website tracking works.
Monitoring your website’s visitors’ actions and behavior can reveal much about your website. Information collected may include, but is not limited to, the source websites from which visitors came, the pages they visit most often, and the total number of pages they see. Website analytics refers to the practice of monitoring these metrics and more.
To further clarify, website analytics is analyzing, collecting, measuring, and reporting data created by internet users to comprehend and better website content and use. The sheer volume of data available to startups and small companies, and the challenge of making sense of it, may be daunting.
An important part of your job as a digital marketer is deciphering this data so you can monitor your site’s health. Some advertising professionals mistake web analytics for site traffic data. There are major distinctions between the two, which you should know. Web analytics provides much more information than web statistics, showing how many visits you had last month.
Simply, web analytics shine a brighter light on “the reason why questions” for things that happen on your site the way they do by highlighting underlying patterns. Overall, web analytics are useful for enhancing your site and its online advertising.
Is Website Analytics Important for Your Business?
The most successful startups and small enterprises record and monitor many indicators. That is crucial since, without it, you have no idea what is or isn’t working for your company. Also, it’s hard to tell where your marketing efforts are going wrong and how to fix the problem as a group.
In reality, most marketers rely on their intuition and “gut instincts” when making crucial business choices. Trusting your instincts is wise, but figures and data are hard to refute. Metrics are simple to compare since they are objective and have no inherent biases. You’re fumbling about in the pitch-black if you aren’t using web analytics.
Web analytics may be carried out in several ways, including creating spreadsheets, social media reports, etc., based on the individual’s comfort level and preference. A well-crafted report can help you show the success of your marketing strategy.
It’s a reliable, evidence-based method of demonstrating the results so far from your efforts. It may serve as a useful roadmap if you include relevant data and insights from marketing initiatives and other endeavors. Website analytics and reporting allow you to gauge the success of your advertising initiatives and iterate your approach. Here is a step-by-step guide for it.
A Step-By-Step Framework to Track a Website’s Visitor Engagement
Step 1 – Determine The Customer Journey Stage
By creating a customer journey map, your business may get insight into the emotions a client is experiencing at each touchpoint, the questions they may be asking (and which you may not be addressing), and the demands they have at each step of their journey with your brand.
Creating a customer journey map may help everyone in your company understand your customers and the role your website plays in their purchasing decisions.
3 stages of a customer journey map:
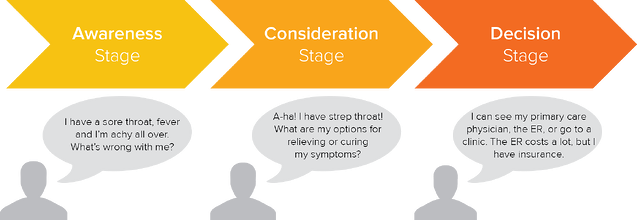
Source: horseshoeco.com
The phases of the customer’s journey—from initial research to final purchase decision—should be the basis for your company’s journey map. Learn more about each step by reading on. You should look at the following to guarantee a smooth progression:
- Awareness
The consumer realizes they have an issue or unmet demand at this point. Your marketing messages should be generic, not include specific products, and concentrate on resolving the customer’s current issue. Put yourself out there through blogs and social media. - Consideration
The shopper now clearly understands the issue at hand and is actively looking for a solution or provider. At this point, they are weighing their available choices. Rather than generally addressing the problem, your marketing messages should focus on the precise pain area, provide a potential solution, and strive to educate the consumer. Consider e-books, white papers, and videos. - Decision
It is at this time that your client will make a choice about which option to implement. Your marketing copy should provide a picture for potential clients of what it would be like to do business with your organization. Defend the merits of your product or service above those of the competition. Try out consultations, demonstrations, and trials on the house.
Why Do People Choose To Visit Your Site?
Is there a common thread that explains the lead’s motivations at each juncture? Exactly what is it that drives them to keep going? How do they feel about their reasons?
What Questions Are They Asking?
And as their trip progresses, so will their curiosity. Which questions must they respond to before proceeding? Is it the jargon of their field or some nigh-impossible idea preventing them from progressing?
What Are They Doing Exactly?
In what ways are potential buyers and existing clients engaging with your business at each stage? In what ways are they preparing for the next level? What are they failing to do?
Where Have They Been Blocked?
Is there anything stopping your visitor from continuing? To wit: what are they? Do they have questions or concerns about your pricing, onboarding, service, or overall process?
You may learn a lot about what consumers may be going through at each step by researching how they use your site and make purchases, conducting interviews with customers, and using tools like heat maps.
Step 2 – Use The Right Tools To Track Your Website
Selecting the best software for your tech stack follows an empathic, user-centric mindset. The mix of engagement monitoring tools you use will vary from company to company and will be based on your organization’s unique objectives.
Quantitative data, such as key performance indicators (KPIs), must be monitored, and qualitative data, which explains the statistics, must be uncovered using appropriate methods.
Google Analytics is a great place to start gathering data and displaying it in simple charts and graphs for tracking and monitoring important quantitative parameters. If you want, you may have the professionals at Cooperative Computing compile a comprehensive report detailing your customer experience and making suggestions for improvement.
Step 3 – Determine The Metrics You Need To Track
Let’s be honest: there is no one set of website interaction metrics that will provide the most useful information about your products. That’s because no other business, website, or set of objectives is like yours. But among the many variables that companies track to succeed in marketing, product development, or sales, the most important ones are:
- Average Time On Page: This metric measures how long visitors spend on a page.
- Average Session Duration: the amount of time a user spends interacting with a website. The average session duration is the amount of time, in seconds, that a user spends on your site from the time they first arrive to the time they click away.
- Pageviews: When a person views a page on your website for the first time or again, this is counted as a pageview. This is distinct from the statistic of “page visits,” which tracks the number of times a visitor views individual pages on your site.
- Pages Per Session: When a person sees a page on your website for the first time or after returning, you have a pageview. Contrast this with “page visits,” which tracks how often people return to your site after first discovering it elsewhere.
- Bounce Rate: The term “bounce rate” describes the percentage of visitors who see a page but leave without taking further action. This number in Google Analytics tells you what proportion of visitors left your site without taking action during the first 10 seconds.
Remember that not all of these indicators will apply to your business needs or end objectives. User’s Bounce rate may not be the most helpful measure to analyze if you’re trying to increase organic traffic and generate leads from your blog. The average time spent on the page might be a better indicator of how much interest your material has for your audience.
And if you’re trying to boost sales from a particular landing page, you’ll be keeping a careful eye on your bounce rate to see where people are leaving and what you can do to discourage them from clicking away.
Step 4 – Identify Why Visitors Are Behaving The Way They’re Based On Data
Metrics for engagement monitoring help understand what is going on with a website. Still, they only reveal half of the picture. On which pages do visitors spend the most time? How high is your landing page’s “bounce rate?”
Website engagement monitoring is useless unless the whys and how’s of user behavior are also investigated. Heatmaps, scroll heatmaps, and recordings are all examples of product experience insights tools that may provide light on how actual people engage with your site.
Let’s say your price page has a high bounce rate and a low average time on the page, but that overall session length is increasing. It seems that visitors are perusing your site, but they are departing before converting. The moment to discover the cause is now.
Using a heatmap, you can see where people spend their time on your site, which might help you figure out what features they aren’t seeing. Recordings allow you to view people as they traverse your site, allowing you to detect issues that cause them to ‘x’ out in frustration, and scroll heatmaps show you how far down the page users go before bouncing, highlighting possible problem areas.
Using these methods, you may determine that customers are confused about the many price points you provide. Why are you doing this? Perhaps the chart has too much data, the prices are too high, the layout is unclear, or you need to experiment with other calls to action or button colors.
Step 5 – Collect Feedback From Visitors Wherever Possible
After monitoring user interaction with your website and investigating the motivations behind their actions, you should consider how you may enhance their time spent there.
Imagine you’ve discovered that people are leaving your site in droves whenever they see a price chart, and you’ve narrowed it down to the quantity of material there. Everything that can be done at this point has been. Modify the current page and do an A/B test using heatmaps to determine which price structure is more successful.
Step 6 – Compile All Data And Make Informed Decisions
After analyzing the data, you should have a general idea of the direction you want your website to go. With this information in hand, you may adjust your website accordingly. There might be clearer connections to the desired actions due to this. Or maybe it’s adding more detailed explanations to each product’s page.
Changes, large or little, will have an impact since they address issues that actual consumers raised. This way, you won’t have to make adjustments in the dark and cross your fingers that they’ll lead to happier customers. You can ensure their wants and problems are never ignored using your client journey map.
Engage Your Audience On Your Website More Effectively Starting Right Now
With the correct approach, you can increase website engagement, enhance the user experience, and convert visitors into brand champions. Always put the user first while making decisions, measuring website interaction, and being ready to try new things. Your stats will begin to improve almost immediately, and your users will be much happier as a result.
For a professional opinion, feel free to reach our customer engagement experts at Cooperative Computing.
Explore More

In today’s hyper-competitive business landscape, retaining existing customers has emerged as the cornerstone of sustainable success. Organizations no longer measure their growth solely by acquiring new customers but increasingly by how well they retain and nurture their current clientele. Why? Because customer loyalty is more than just a revenue driver—it represents trust, satisfaction, and advocacy, […]

Discover the power of hyper-personalization solutions in customer engagement and how they revolutionize business strategies.

The metaverse is presently the focus of intense competition among IT businesses. However, aside from significant financial investment, it is still unclear exactly what it will take to win. Will it just replicate the existing digital environment, or will it be a new and improved version? Will our 2D displays, which are currently clogged with […]